How-To: Reporting on Graduating Students
At the end of a semester, quarter, or term, institutions may wish to track the loan and fine activity of students that are anticipated to graduate. This page identifies a process and reports that will assist with this effort. While this process appears long and cumbersome, the actual tasks require only a few minutes each, and the results are reusable after being applied.
Configuration of Statistical Categories
The first part of this process involves creating a user statistical category, which is a four part procedure in Alma Configuration. With enough planning, library staff could complete this step at any time, including the beginning of a semester, which would allow the category to be applied to student records using the SIS load.
Part 1. One-time configuration details.
Here, you create a category type that will group individual values later, then assign that type to one of five analytics attributes used for statistical categories. This process should only require one-time setup.
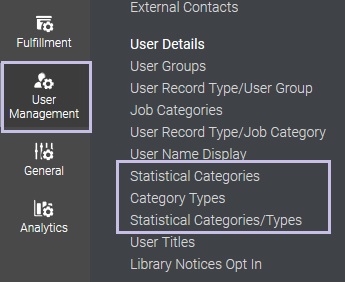
Note: The Statistical Categories/Types menu option may not appear until you have one or more Category Types defined.
- Go to Alma Configuration.
- Go to User Managment > User Details > Category Types.
- Click Add Row.
- Enter a code for the category, e.g., gradTerm
- Enter a description for the category, e.g., Graduating Term.
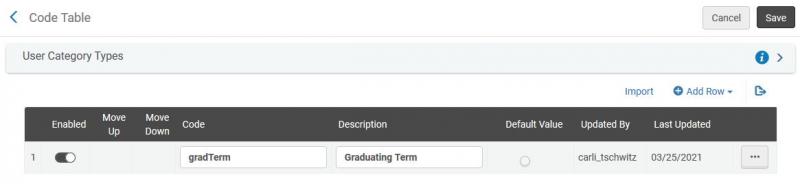
- Click Save.
- Go to Analytics > General Configuration > Analytics User Statistics.
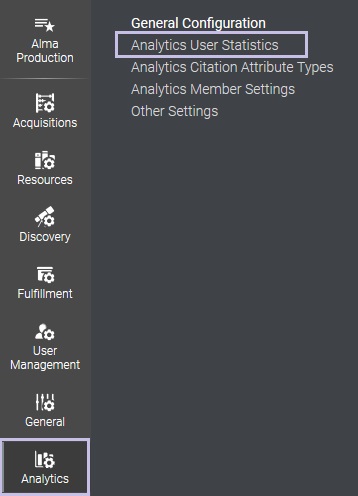
- In the row for STATISTICS_1, select the category type that you defined above, e.g., Graduating Term.
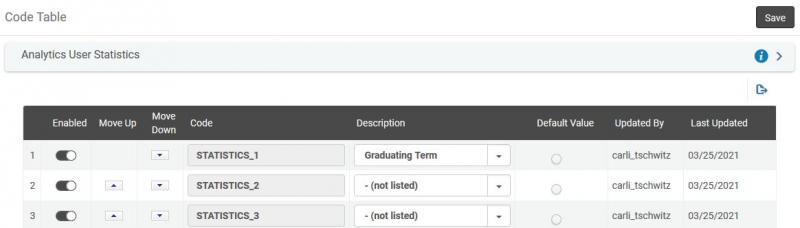
- Click Save.
Part 2. Semester configuration details.
Here, you define the specific values for a category, for example, a year and semester, then assign that category to a type. This process would be repeated each semester.
- Go to User Managment > User Details > Statistical Categories.
- Click Add Row.
- Enter a code for the category, e.g., grad21spring
- Enter a description for the category, e.g., 2021 Spring Graduating Students.
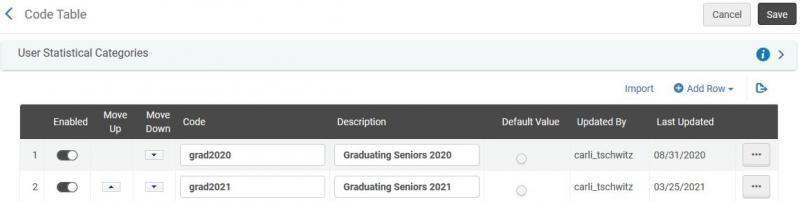
- Click Save.
- Go to User Managment > User Details > Statistical Categories/Types.
- Click Add Row.
- Select your new category in the Statistical Category list, e.g., 2021 Spring Graduating Students.
- Select your the Category Type from the list, e.g., Graduating Semester.
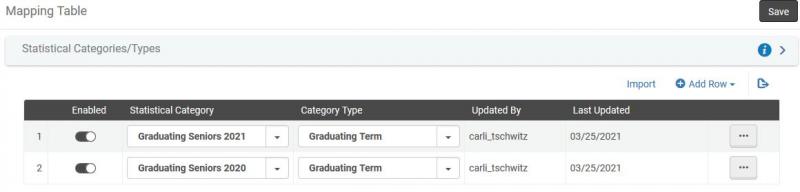
- Repeat steps 7-9 if needed to map more category values to category types.
- Click Save.
- Exit configuration and go back to the main Alma workspace.
Assigning the Statistical Category to Students
Part 1. Create a record set of your graduating students using an Excel file.
- Edit your excel file; make sure that the column containing the Primary Identifier has the heading of "User name". Save the file.
- Go to Admin > Manage Jobs and Sets > Manage Sets.
- Click Add Set > Itemized Set.
- Enter a set name, e.g., Set Spring 2021 Seniors. Optionally add a description and note.
- Select the Set Content Type of User.
- Change Private to No.
- Under Add Contents from File to Set, click the folder icon, then browse to the location of your excel file. Select the file in the browse window, then click Open.
- Click the Save button to create the set.
- You should receive an email notification when the set has been created.
Part 2. Apply statistical category to the set of users.
- Go to Admin > Manage Jobs and Sets > Run a Job.
- Locate the Update/Notify Users job (e.g., scroll in the list, or type "User" in the Description box and click the search button), select the job and click Next.
- From the list of sets, select your user set created in part 2. (e.g., Set Spring 2021 Seniors). Click Next.
- In the Task Parameters list, locate the parameter Added/Changed Field, then select Internal.
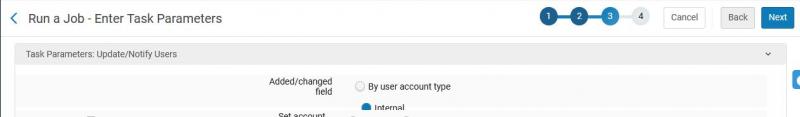
Note: Selecting "Internal" here means that the statistics category will be applied as an internal value, so that it will not be replaced by any updates from routine SIS record loads.
DO NOT modify the Set Account value to Internal. This will modify the records to be internal to Alma, and prevent the whole record from being updated by routine SIS loads. - Scroll down to the parameter for Add Statistics (category). Tick the box to the left, then select your new category as created in part 1 from the drop down list. (e.g., 2021 Fall Graduating Students). Click Next.
- Review the job information and settings. Then click Submit. You'll get a confirmation message that identifies how many records will be affected. Click Confirm to run the job.
- You should receive an email notification when the job has completed.
Creating and Running Reports
As Analytics data are delayed by a day from real time in Alma, you must wait overnight before you can modify and run reports on these users.
CARLI staff and libraries piloting this process have created shareable reports that you may copy into your shared reports folder. There are two reports to copy, which are located at /Shared Folders/Community/Reports/Consortia/CARLI/Shared Reports/Fulfillment. Reports are named:
- Graduating Student Identifiers
- Graduating Students with Local Loans
- Open Analytics: Go to Analytics > Access Analytics.
- Click Catalog.
- Expand the Shared Folders down to CARLI's shared reports:
e.g., Shared Folders > Community > Reports > Consortia > CARLI > Shared Reports > Fulfillment. - Locate the reports by name in the list. When found, select More > Copy.
- Change folders into your institution's reports folder.
e.g., Shared Folders > [institution name] > Reports - Click the Paste button on the toolbar.
- Click Edit to do a test-run of the report or modify the design
After copying the Graduating Student Identifiers report, you will need to edit the report so that it matches your own statistical category.
- Click Catalog.
- Locate the Graduating Student Identifiers analysis and click Edit. If the report runs, then click Criteria.
- Under filters, hover over the Statistical Category filter, then click on the edit filter icon (a pencil).
- Change the filter value to be the statistical category code that you created above, e.g., grad2021spr. Click OK.
- Click the Save button.
- Click Results to run the analysis.
After copying the Graduating Students with Local Loans report, you will need to edit the report so that it uses the correct analysis to locate loans.
- Click Catalog.
- Locate the Graduating Students with Local Loans analysis and click Edit. If the report runs, then click Criteria.
- Under filters, hover over the Primary Identifier filter, then click on the edit filter icon (a pencil).
- In the Saved Analysis field, click Browse; locate and select the Graduating Student Identifiers analysis that is stored in your institution's folder, then click OK.
- Click OK to save your filter.
- Click the Save button.
- Click Results to run the analysis.
Last updated December 12, 2025.