How To: Getting Started with Analytics
Roles
To work with Analytics, you need the Design Analytics role. This role authorizes you to view and copy existing analyses and create new analyses. With this role, you can open Analytics using Analytics > Access Analytics.
Viewing Shared Analyses in the Catalog
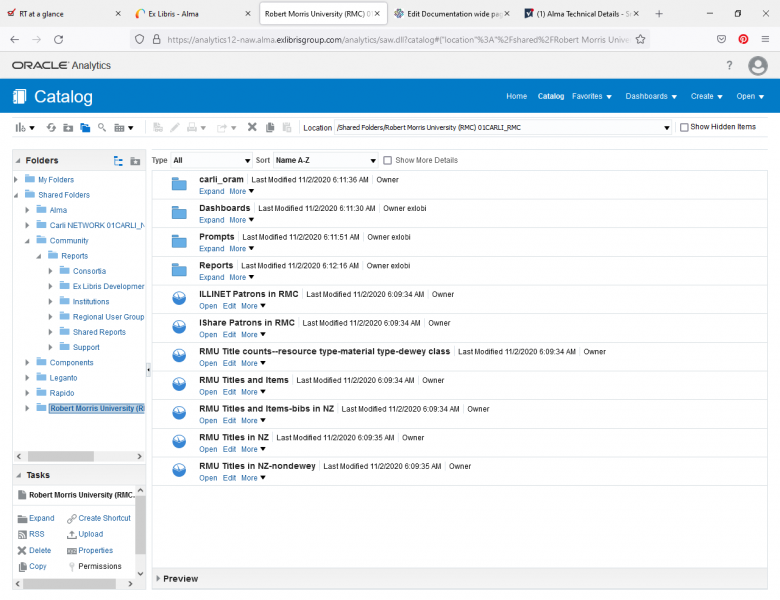
To view items in the Shared Catalog, select Catalog.

A panel opens up on the left side of the page. You will see two folders: My Folders and Shared Folders.
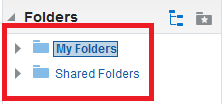
My Folders contains a workspace for analyses that you create or copy. Only you have access to it. Shared Folders is where the shared analyses are stored.
Your Institution's Folder
To view analyses in your institution's shared folder, you need to scroll down to the bottom of the shared folders until you see a folder with your institution's name.
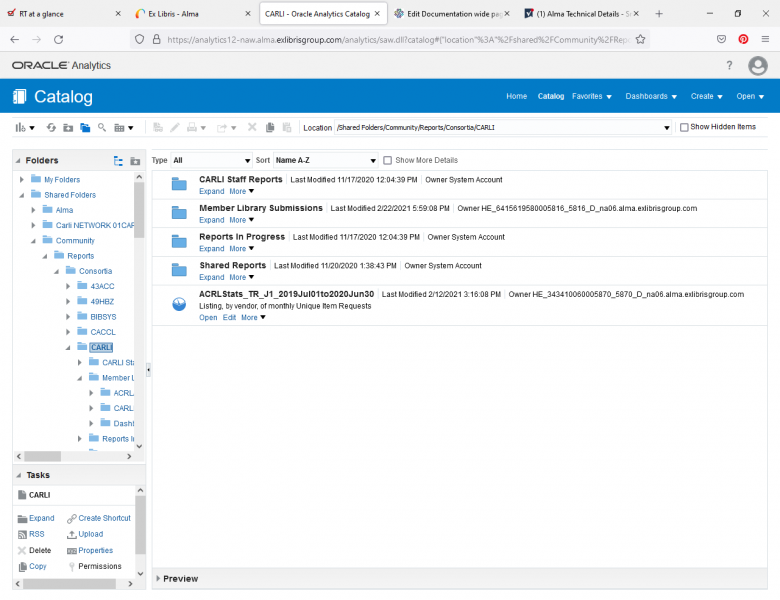
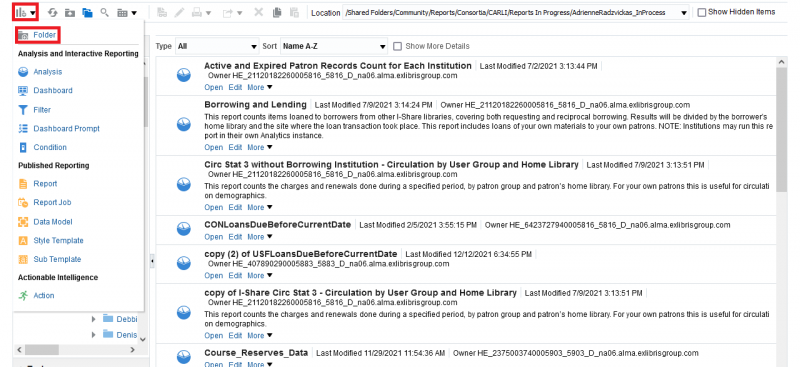
CARLI Shared Folders
To view reports in the CARLI shared folders, select Shared Reports > Community > Reports > Consortia > CARLI. There are two folders that might be of interest to you. Member Library Submissions contain the analyses that other member libraries have created or copied for use by other libraries. Shared Reports contains analyses the CARLI staff have created for use by one more more libraries. Select Expand to view the reports.
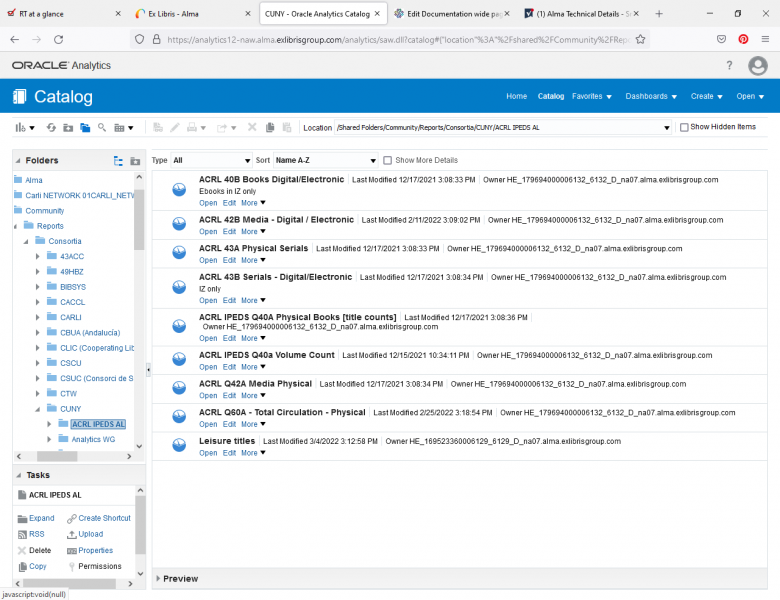
CUNY ACRL Shared Folders
To view reports in the CUNY ACRL/IPEDS shared folder, select Shared Reports > Community > Reports > Consortia > CUNY > ACRL IPEDS AL.
Searching Shared Folders
You can search the shared folders for a keyword in a folder or analysis. For example, let's say that you want to look for analyses for ACRL reporting. To search the shared folders:
- Select the folder that you want to search.
- Select the magnifying glass in the upper-left corner.

- Enter the search term in the box.
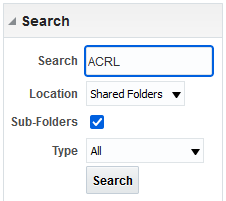
- Select the location if it isn't selected already.
- Select Search.
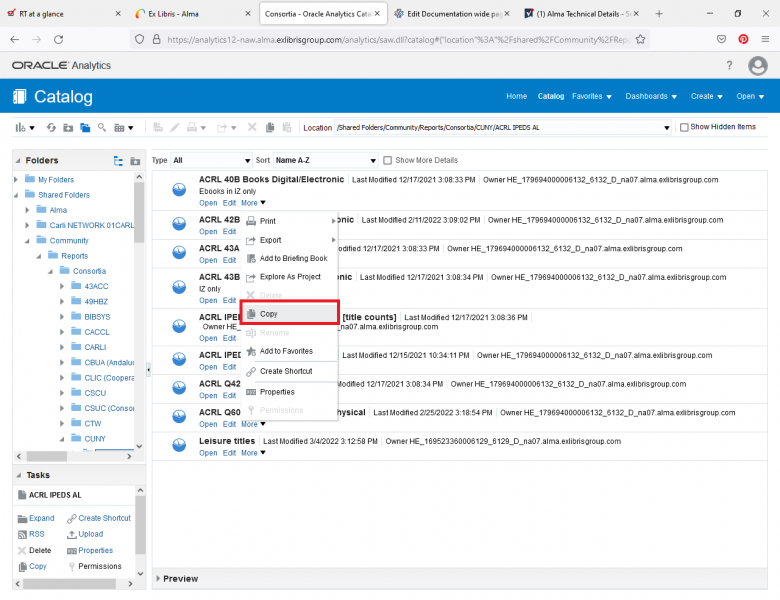
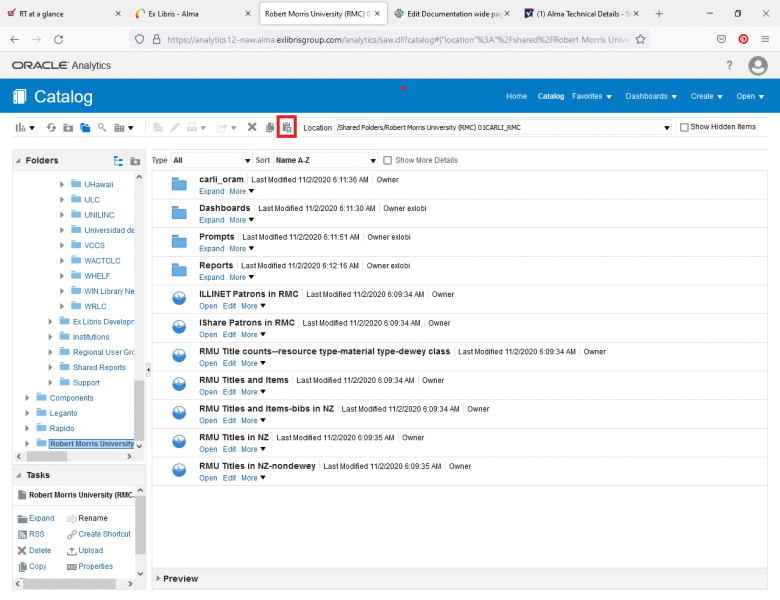
Copying and Pasting an Analysis
Before you make any changes to a shared report, copy and paste it to your My Folders folder or your institution's folder.
To create a new folder, choose the icon in the upper left-hand corner that looks like a bar chart:
Enter the name of the new folder.
To copy an analysis, under the analysis name, select More > Copy.
To paste the analysis to your folder, navigate to your folder and select the Paste icon.
You then can open the analysis and make any changes that you would like.
Exporting an Analysis to Excel
You can export the results of an analysis to Excel to sort, search, print, etc. To export:
- Open the analysis.
- Select Results.
- Select the icon that looks like an arrow going off of a page.

- Select Formatted > Excel.
The Excel file will open.
Creating a New Analysis
To start a new analysis, select Create > Analysis. Note that you don't want to select Report because it's not supported under Alma, and Oracle will ask you for a login that you don't have.
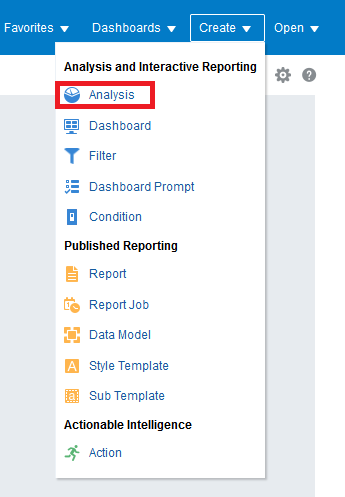
Then you need to select a subject area. A subject area is a set of related tables describing a particular type of data in Alma. Some examples are Fulfillment, which has to do with loan histories, and Physical Items, which has to do with library inventory. For a complete list of subject areas, see Alma Analytics Subject Areas. Select the link to a subject area for a data dictionary of that subject area.
Editing an Analysis
You can add or delete fields or add a filter in the analysis. See also "Creating an Analysis" for more information about the different subject areas.
To open the analysis, select Edit > Criteria. You will then see the fields and filters included in the analysis.
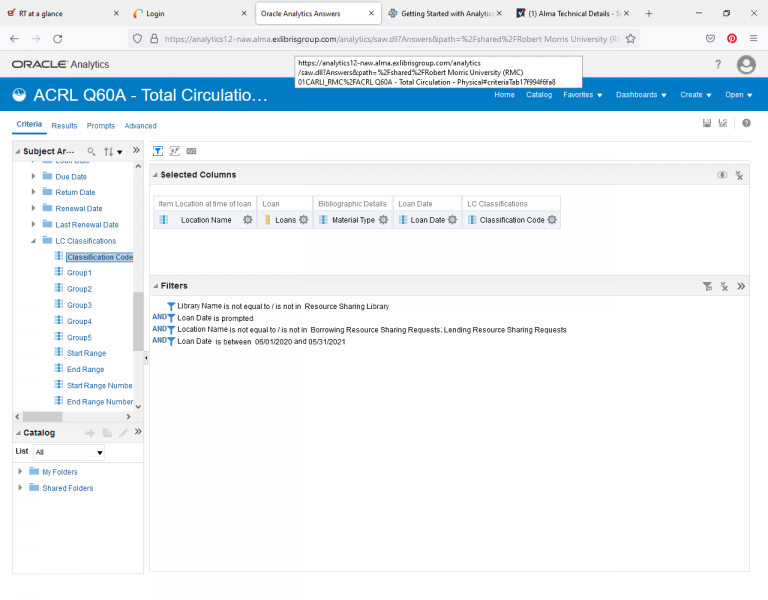
Adding a field
You will see a list of fields on the left-hand side of the screen. Double-click a field or drag and drop it into the Selected Columns display. You can reorder the fields through dragging and dropping. Be aware that if you have run the analysis already, you will also have to reorder the fields in the Results tab.
In the following image, I added the LC classification field.
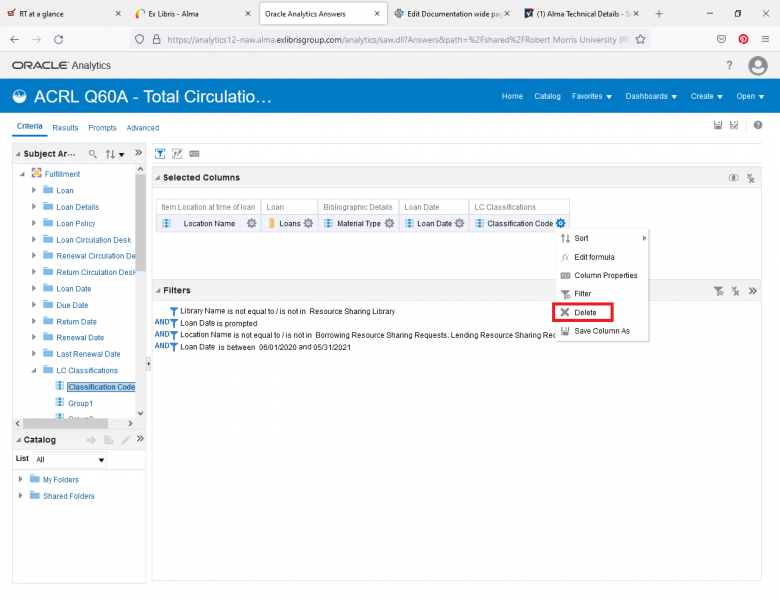
Deleting a Field
To delete a field, select the gear icon next to the field name and select Delete. In the following image, I'm deleting the LC Classification Code field.
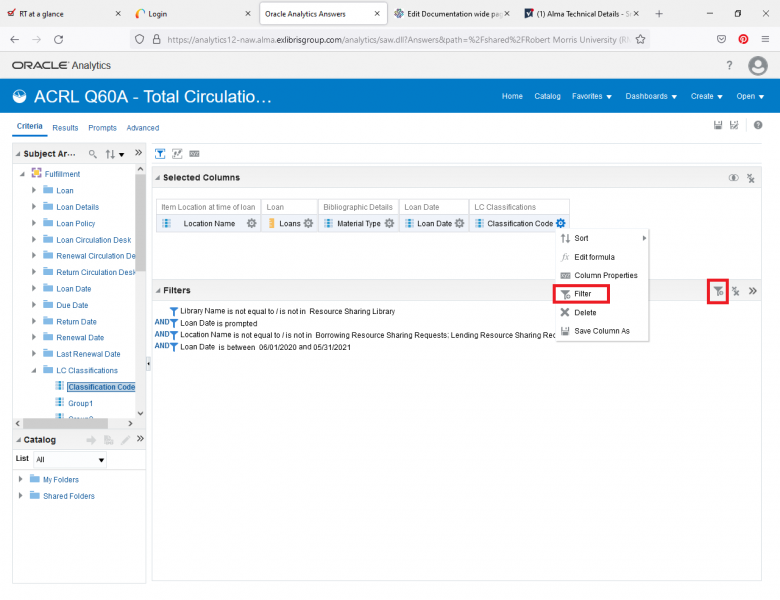
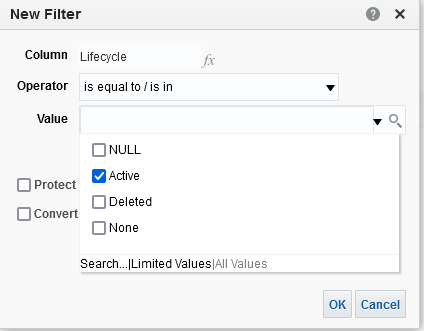
Applying a Filter
You can apply a filter to a column that is displayed in your analysis or to one that is not displayed. One use of a filter of a field that is not displayed is to select only those Physical Items that are active because Analytics contains items that have been deleted as well.
To filter a column displayed in your analysis:
- Select the gear icon next to the column name and select Filter.
- Select the operator (most frequently is equal to/is in or is not equal to/is not in, but there are a variety of options).
- Select the value.
To filter a field not displayed in your analysis:
- Select the icon that looks like a funnel in the right-hand corner of the Filters section (see above).
- Select More Columns.
- Select the name of the folder that you would like to expand.
- Select the column name.
- Select the operator (most frequently is equal to/is in or is not equal to/is not in, but there are a variety of options).
- Select the value.
- Select OK.