ILLINET Interlibrary Loan Traffic Survey Analysis: FY2012-FY2016
Introduction
The CARLI Resource Sharing Committee’s annual project for 2016-17 analyzes current trends related to interlibrary loan and resource sharing activities for returnable and non-returnable items in Illinois academic libraries. Since the Illinois State Library requires the annual submission of the ILLINET Interlibrary Loan Traffic Survey, the Committee sought to analyze requesting (borrowing) and supplying (lending) data from the past five years to see if there were any noticeable trends that would be of interest to academic libraries and CARLI member institutions in particular. It is hoped that this analysis will be useful for goal setting, resource allocation, planning for staffing, library policy review, collection justification, and peer institution benchmarking.
The Committee conducted a literature review and found that current literature on Illinois-specific resource sharing practices were not easy to come by, with an article by Wiley and Chrzastowski (2005) being the most relevant to our research. In the absence of sources relevant to our research project, we decided to focus on the data provided by academic libraries in Illinois on the ILLINET Interlibrary Loan Traffic Survey (Illinois State Library, 2012, 2013, 2014, 2015, 2016).
Methods
The raw data came from the ILLINET Interlibrary Loan Traffic Survey (Illinois State Library, 2012, 2013, 2014, 2015, 2016). This is a report that the Illinois State Library requires Illinois libraries of all types, including academic, to complete annually. The Survey summarizes the total number of interlibrary loan requests (both requesting and supplying) that libraries process annually, and it breaks them down into additional categories, such as returnables vs. non-returnables and in-state vs. out-of-state. Illinois libraries can search previous years’ survey results after logging into Counting Opinions (the company that manages the data) on the State Library’s website (Office of the Illinois Secretary of State).
As the data analysis below notes, the number of libraries submitting the ILLINET Interlibrary Loan Traffic Survey varied from year to year. Specifically, there was a large increase in the number of libraries submitting the survey in FY2015, as opposed to FY2014 and earlier. This was due to a decision by the Illinois State Library to encourage more libraries to complete the survey by linking it with Illinois State Library Certification. Before FY2015 submitting the survey had been a requirement with no penalty for noncompliance.
In order to provide a trend analysis of the data, we had to first identify the libraries that provided data for all five fiscal years. Raw data reports were downloaded from the Counting Opinions site that houses the ILLINET Interlibrary Loan Traffic Survey, and the data was deduplicated so data was provided only once for each institution (for some reporting years, individual library branches reported their statistics separately).
The data analysis is organized into two sections covering requesting (when a patron requests an item not owned by their home library), and supplying (when another library provides materials to a requesting library).
In recognizing the higher number of reporting institutions from FY2015 and FY2016, we also analyzed the same data in requesting and supplying, organized by the type of institution. We looked up the individual institutions included in the full report and assigned the institution type by the highest degree offered. The data is presented through line and bar graphs to visually demonstrate the trends in data, and a brief analysis is provided.
Data Analysis
Library Data Included in Analysis:
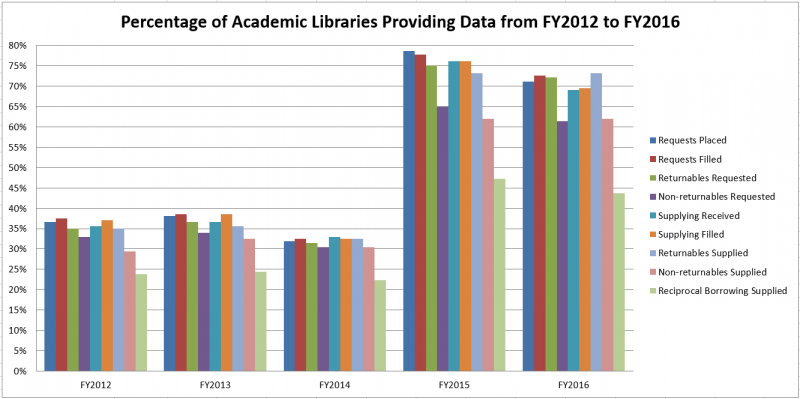
In order to conduct a trend analysis over several years, we included only academic libraries that reported data for all five years. Because the number of libraries submitting data increased from FY2012 to FY2016, with approximately twice the number of libraries submitting data in 2015/2016, we have also provided an analysis of interlibrary loan data for FY2015 and FY2016 organized by the type of institution. Based on the large jump in reporting from FY2014 to FY2015, it is evident that tying the completion of the ILLINET Interlibrary Loan Traffic Survey to the Illinois State Library Certification process was effective in encouraging more libraries to complete the survey, thus providing more complete data. (Figure 1)
Requesting (Borrowing):
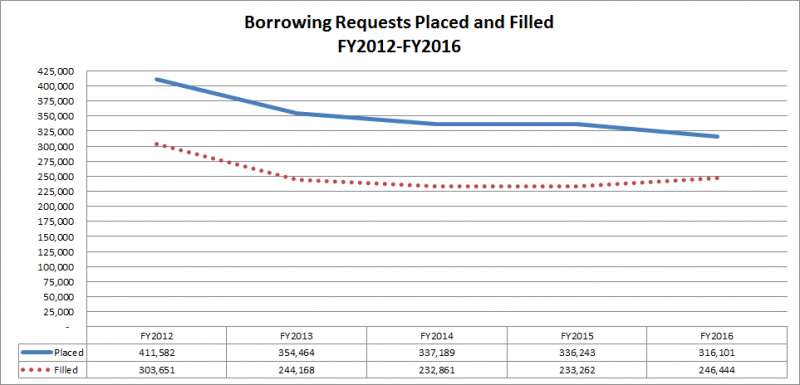
From FY2012 to FY2016 there was a 23% decrease in the borrowing requests placed at the 44 academic libraries that submitted data for all 5 years. There was a 19% decrease in the borrowing requests filled at the 42 academic libraries that submitted data for all 5 years. (Figure 2)
- Most notable is the significant decrease of 14% borrowing requests being placed from FY2012 to FY2013.
- From FY2013 through FY2016 the borrowing requests have remained relatively stable with an average decrease of 4% from year to year.
- From FY2015 to FY2016, despite a 6% decrease in the number of requests placed, the percentage of requests filled increased 5%.
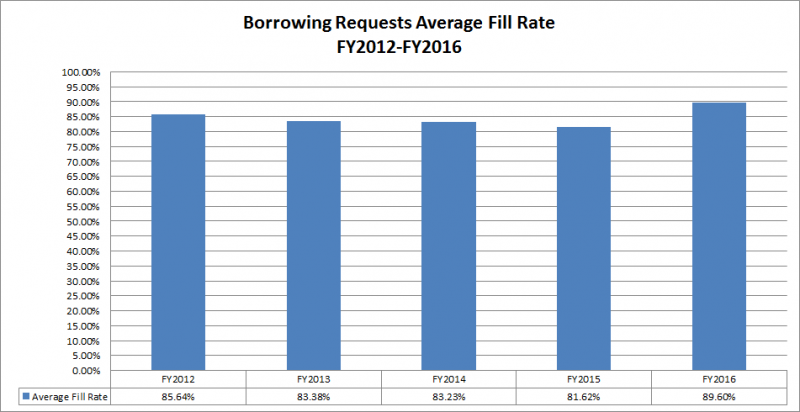
From FY2012 to FY2016 the average fill rate of the borrowing requests that were placed and filled by the 42 academic libraries that provided data for all 5 years remained stable within the 80% range. (Figure 3)
- This chart shows the average of fill rates for each library, not the number of filled requests.
- The majority of borrowing requests placed by patrons are filled.
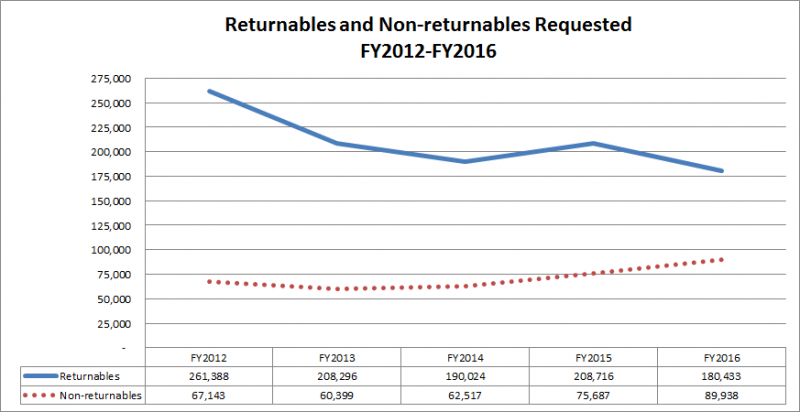
For the ILLINET Interlibrary Loan Traffic Survey libraries report the number of physical items that their local patrons receive that must be returned to the owning library (returnables) and the number of electronic items received that do not need to be returned to the owning library (non-returnables).
From FY2012 to FY2016 there has been a 31% decrease in returnable items being borrowed, but there has been a 34% increase in number of non-returnables being borrowed. (Figure 4)
- While many think that interlibrary loan is primarily used for requesting electronic versions of articles not available in the collection, this data shows that despite the decrease in returnables being requested and the increase in non-returnables being requested, returnable items are still the most requested type of items by library patrons.
Because only 22% of academic libraries provided data for the borrowing requests placed and 21% provided data for the borrowing requests filled for all 5 years, we have also analyzed the borrowing request data for FY2015 and FY2016 to obtain a comparison by the type of institution. Institutions are grouped by the highest degree offered by the school.
For FY2015 and FY2016 69% of libraries provided data for the number of borrowing requests placed, 71% of libraries provided data for the number of borrowing requests filled, and 65% of libraries provided data for the fill rate.
Number of Institutions Providing Data by Highest Degree Offered (FY2015-FY2016):
| Institution Type | Placed | Filled | Fill Rate |
| Doctoral | 21 | 21 | 20 |
| Graduate | 46 | 45 | 43 |
| Undergraduate | 23 | 23 | 22 |
| Community College | 46 | 50 | 44 |
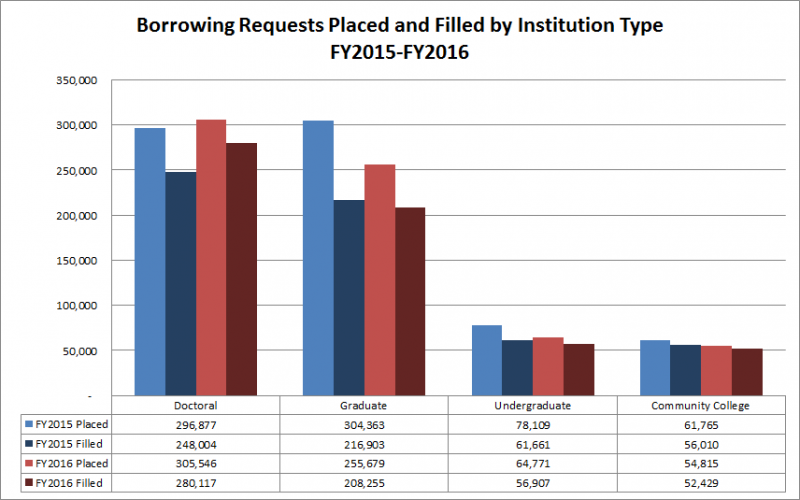
The graph on the Borrowing Requests Placed and Filled by Institution Type shows that Doctoral and Master’s granting institutions have the highest number of borrowing requests placed and filled of the four institution types. (Figure 5)
- This is reflective of the type of research conducted by patrons at institutions that grant doctoral and master’s degrees that they would be more likely to require more specialized resources requiring requests to be filled via interlibrary loan.
- However, the data also shows that undergraduate and community college patron requests are more likely to be filled than the patron requests from doctoral and master’s institutions.
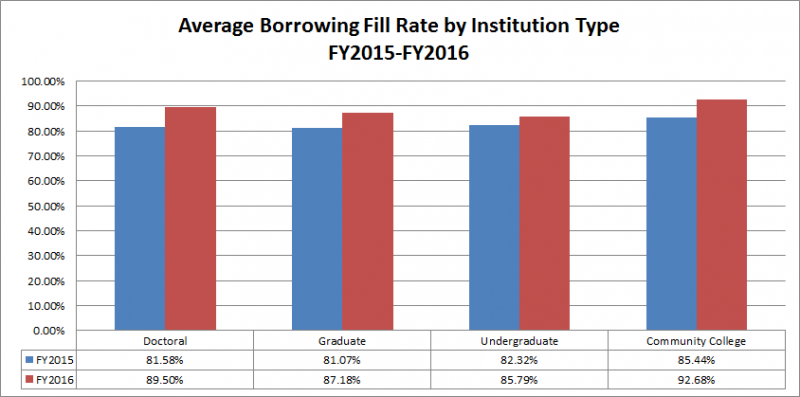
The average fill rate for patron requests from all institution types has increased from FY2015 to FY2016. This shows that fill rates for patron requests by institution type are also around the 80% range. (Figure 6)
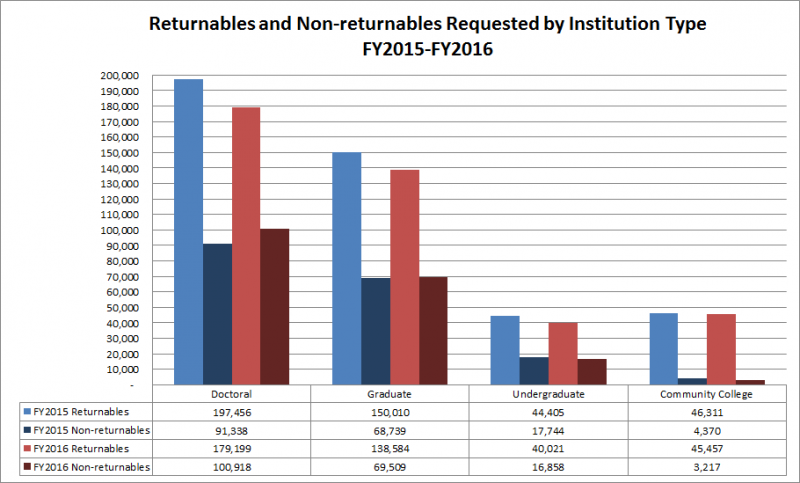
We also analyzed the returnable and non-returnable items that were borrowed by institution type.
Number of Institutions Providing Data for Returnables and Non-returnables Requested (FY2015-FY2016):
| Institution Type | Returnables | Non-Returnables |
| Doctoral | 21 | 21 |
| Graduate | 44 | 43 |
| Undergraduate | 21 | 18 |
| Community College | 45 | 33 |
This data also shows that patrons request and receive returnable items at a much higher amount than non-returnable items. This is consistent across all institution types. (Figure 7)
Supplying (Lending):
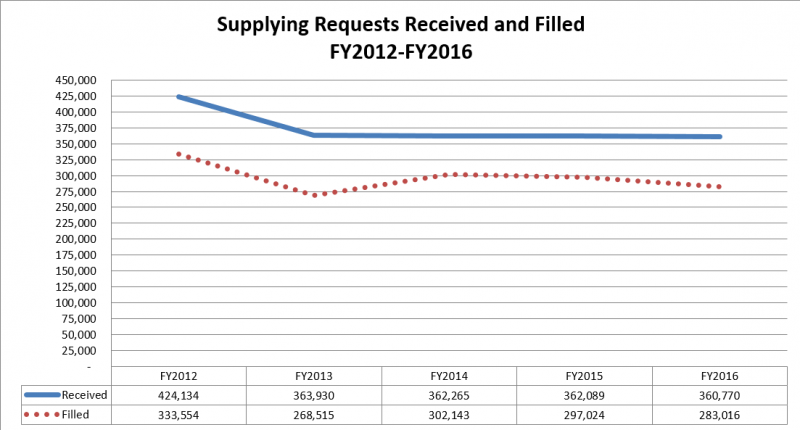
From FY2012 to FY2016 there was a 15% decrease in the number of supplying requests placed as well as the number of supplying requests filled at the 42 libraries that submitted data for both supplying requests placed and filled for all five years. (Figure 8)
- Similar to borrowing requests, the most notable decrease was from FY2012 to FY2013 with a 14.19% decrease in supplying requests placed.
- The year to year average decrease for supplying requests placed for FY2013 to FY2016 was only 0.29%.
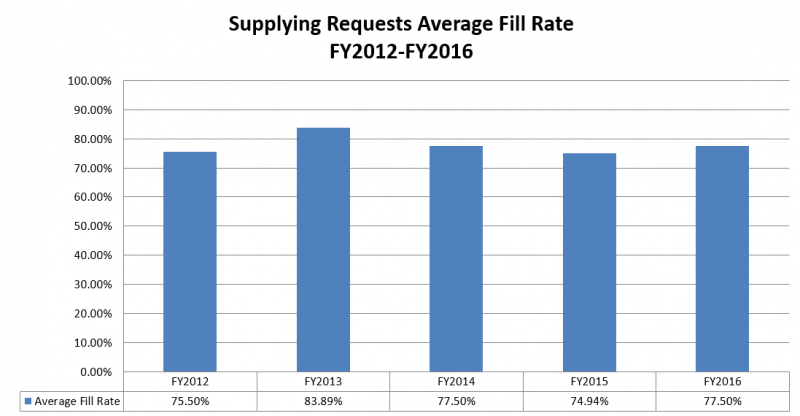
The average fill rate for supplying requests at the 40 academic libraries that provided data for all five years is around 75-85%, and has remained relatively stable for all five years. (Figure 9)
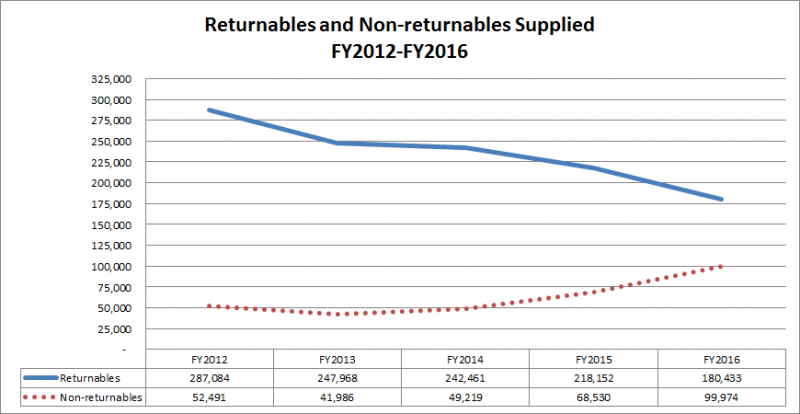
From FY2012 to FY2016 there was a 37% decrease in returnables supplied at the 41 libraries that provided data for all five years. Conversely there was a 90% increase in non-returnable items supplied at the 36 libraries that provided data for all five years. (Figure 10)
"Items Supplied via Reciprocal Borrowing" refers to when a patron from a library in which there are shared borrowing privileges borrows an item on site at the lending library. This can apply to a patron from one I-Share library visiting another I-Share library and borrowing materials, or if the academic library has a reciprocal borrowing agreement with the local public library or non-I-Share library.
- Some libraries may have misinterpreted the meaning of reciprocal borrowing to refer to the lending of materials through resource sharing agreements and not as the on-site borrowing of materials by patrons from another library; as a result, the numbers reported for reciprocal borrowing may not be fully accurate.
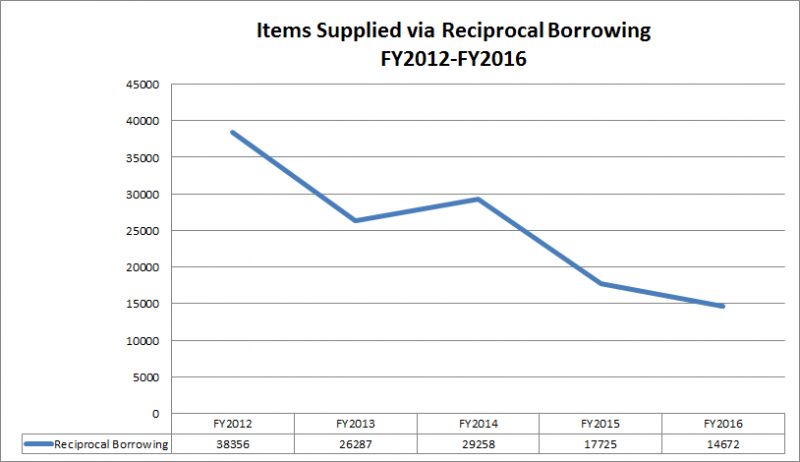
From FY2012 to FY2016, items loaned via Reciprocal Borrowing from the 24 academic libraries that submitted data for all 5 years decreased by 62%. (Figure 11)
Number of Institutions Providing Data by the Highest Degree Offered (FY2015-FY2016):
| Institution Type | Placed | Filled | Fill Rate |
| Doctoral | 20 | 20 | 19 |
| Graduate | 44 | 44 | 41 |
| Undergraduate | 21 | 21 | 20 |
| Community College | 46 | 49 | 45 |
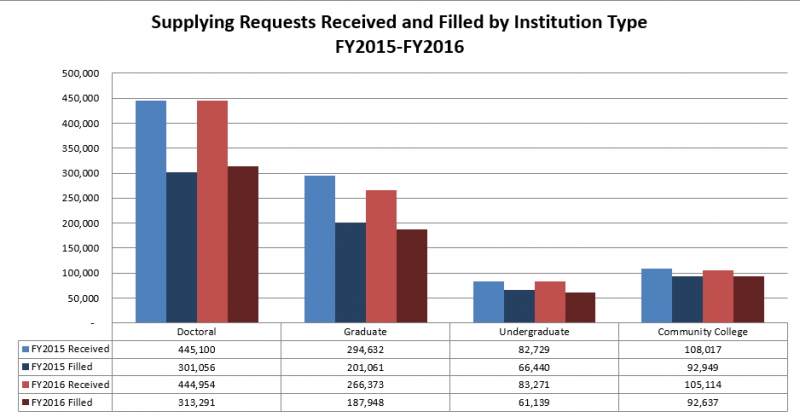
Doctoral granting institutions received the highest number of lending requests. (Figure 12)
- This could be reflective of the type of collections held by doctoral granting institutions.
- Similar to the borrowing requests by institution type, the undergraduate and community college libraries had higher fill rates than doctoral and master’s institutions.
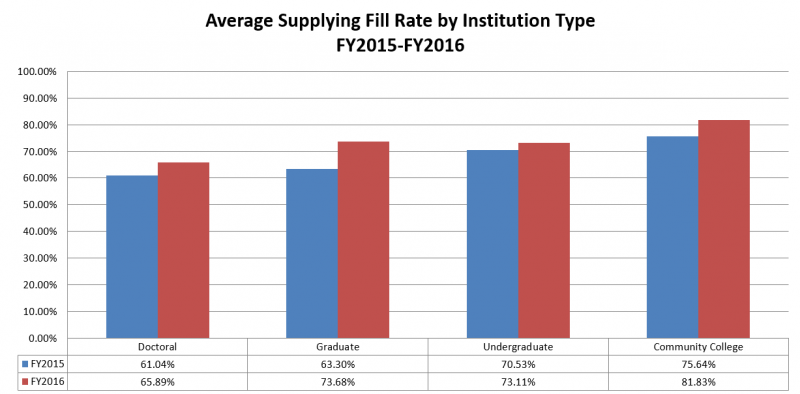
The average lending fill rate by institution type from FY2015-FY2016 range from around 60% to 80% depending on the institution type. Community college libraries have the highest average lending fill rate for both FY2015 and FY2016. (Figure 13)
Number of Libraries Providing Data on request type by Institution Type (FY2015-FY2016):
| Institution Type | Returnables | Non-returnables | Reciprocal Borrowing |
| Doctoral | 20 | 20 | 15 |
| Graduate | 44 | 45 | 25 |
| Undergraduate | 21 | 16 | 10 |
| Community College | 47 | 29 | 19 |
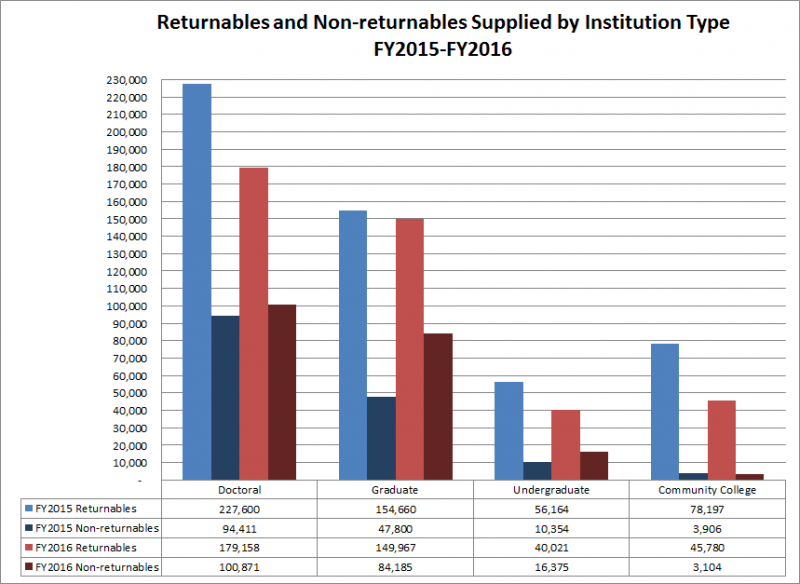
When looking at the type of items supplied by institution type from FY2015 and FY2016, it is clear that returnable items are the most supplied type of materials. However, the number of returnables supplied did decrease for all institution types from FY2015 to FY2016, and the number of non-returnable items supplied increased for all institution types except for community college libraries. (Figure 14)
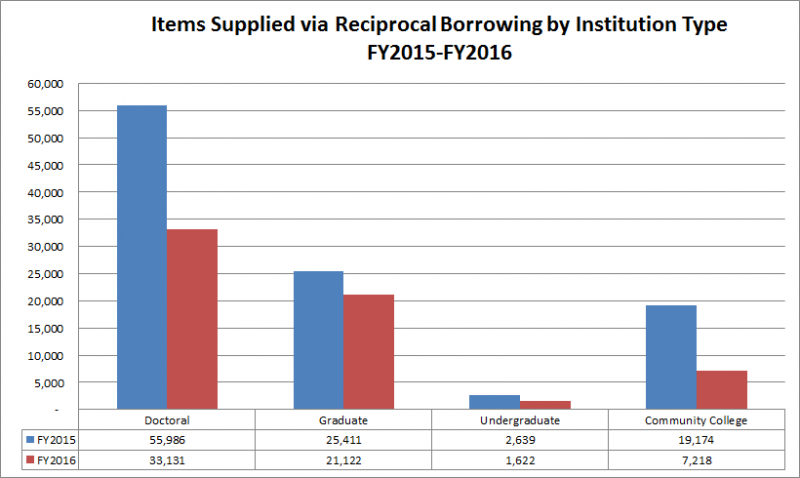
When viewing the "Items Supplied via Reciprocal Borrowing by Institution Type" there is a clear drop from FY2015 to FY2016 for all institution types. (Figure 15)
Conclusion
We hope this analysis provides useful data to academic libraries and provides a snapshot of recent trends in resource sharing within Illinois. The data analysis does show that interlibrary loan requests, although declining, remain an inherent value to library services. The Committee feels this study is just a start for further data analysis.
Trends in the data encourage further investigation into these possible connections:
- Trends in campus enrollment
- Changes in patron resource needs
- Library space reorganization; print as smaller percentage of collection
- Faculty involvement in libraries/promotion of library resources
- Cost effectiveness of purchase vs. borrowing material
- The availability of open access content and full text databases
- Licensing options for e-content suppliers
The Committee would like to thank Gwen Harrison, Network Consultant at the State Library, for serving as a liaison between the Committee and Counting Opinions, especially for seeking assistance with technical issues that Committee members encountered while running reports on the data.
References
- Illinois State Library. (2012). [ILLINET interlibrary loan traffic survey]. Unpublished raw data.
- Illinois State Library. (2013). [ILLINET Interlibrary loan traffic survey]. Unpublished raw data.
- Illinois State Library. (2014). [ILLINET interlibrary loan traffic survey]. Unpublished raw data.
- Illinois State Library. (2015). [ILLINET interlibrary loan traffic survey]. Unpublished raw data.
- Illinois State Library. (2016). [ILLINET interlibrary loan traffic survey]. Unpublished raw data.
- Office of the Illinois Secretary of State. (n.d.). ILLINET interlibrary loan traffic survey Illinois State Library. Retrieved from http://www.cyberdriveillinois.com/departments/library/libraries/ill_survey.html
- Wiley, L., & Chrzastowski, T. (2005). The impact of electronic journals on interlibrary lending: A longitudinal study of statewide interlibrary loan article sharing in Illinois. Library Collections and Technical Services, 29 (1), 364-381.